
Delivery Route Analytics That Answer
the Questions You’re Already Asking

10,000+ teams have improved margins
and performance with Upper






You have delivery data
everywhere. Answers nowhere.
What Route Planning Software Promises:
-
 Know how your operation is performing
-
Track driver productivity
-
Prove ROI on your software
-
Spot problems early
-
Make data-driven decisions

What Actually
Happens:
-
Data in one system, reports in another, nothing connects
-
“Productivity” = whoever gets the fewest complaints
-
“I think we’re saving money” isn’t proof
-
You find problems when customers call, not before
-
Decisions based on the last crisis, not the full picture
One Dashboard. Every Metric.
Zero Spreadsheets.
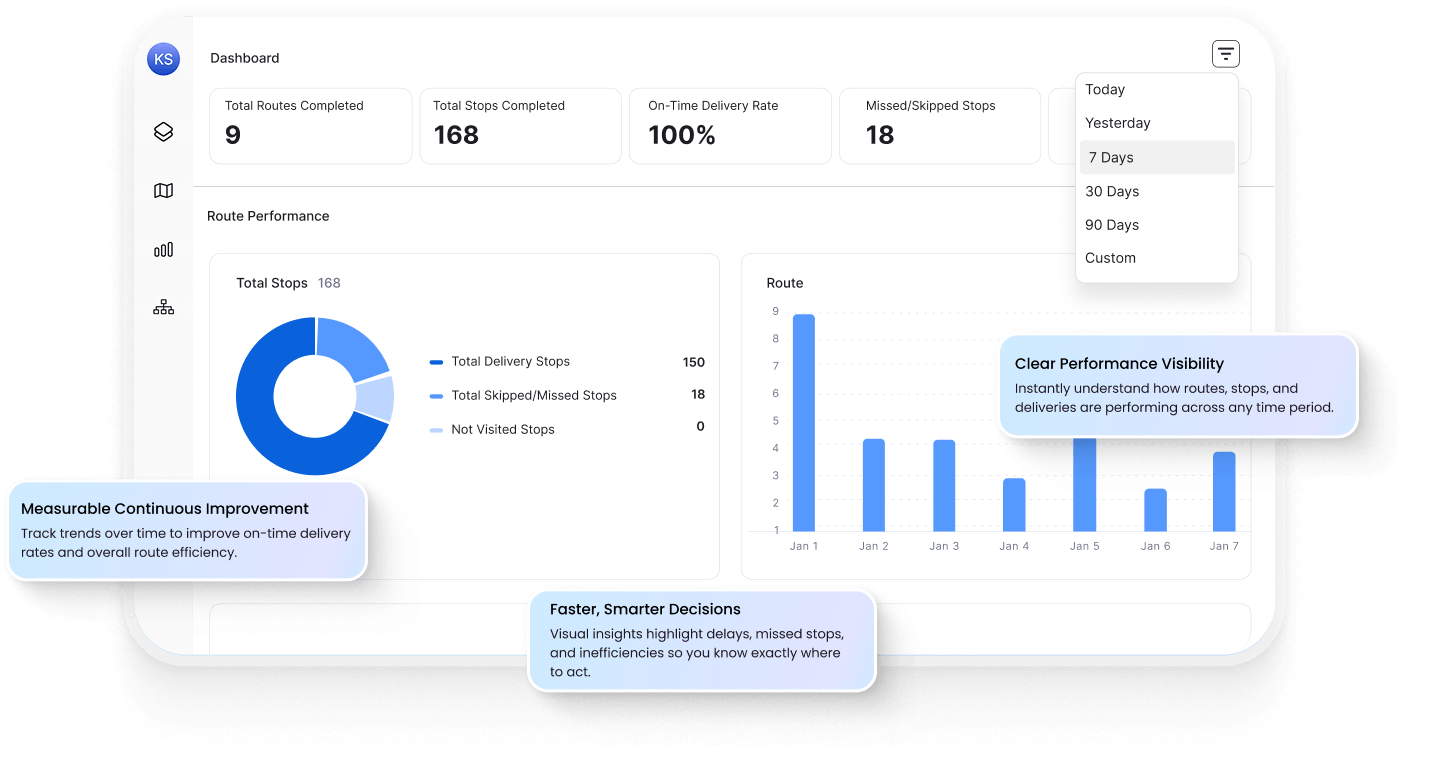
No more piecing together reports from three systems. Upper gives you a single dashboard with every metric that matters — routes, drivers, deliveries, costs — ready when you need it.
Real-Time Operations Dashboard
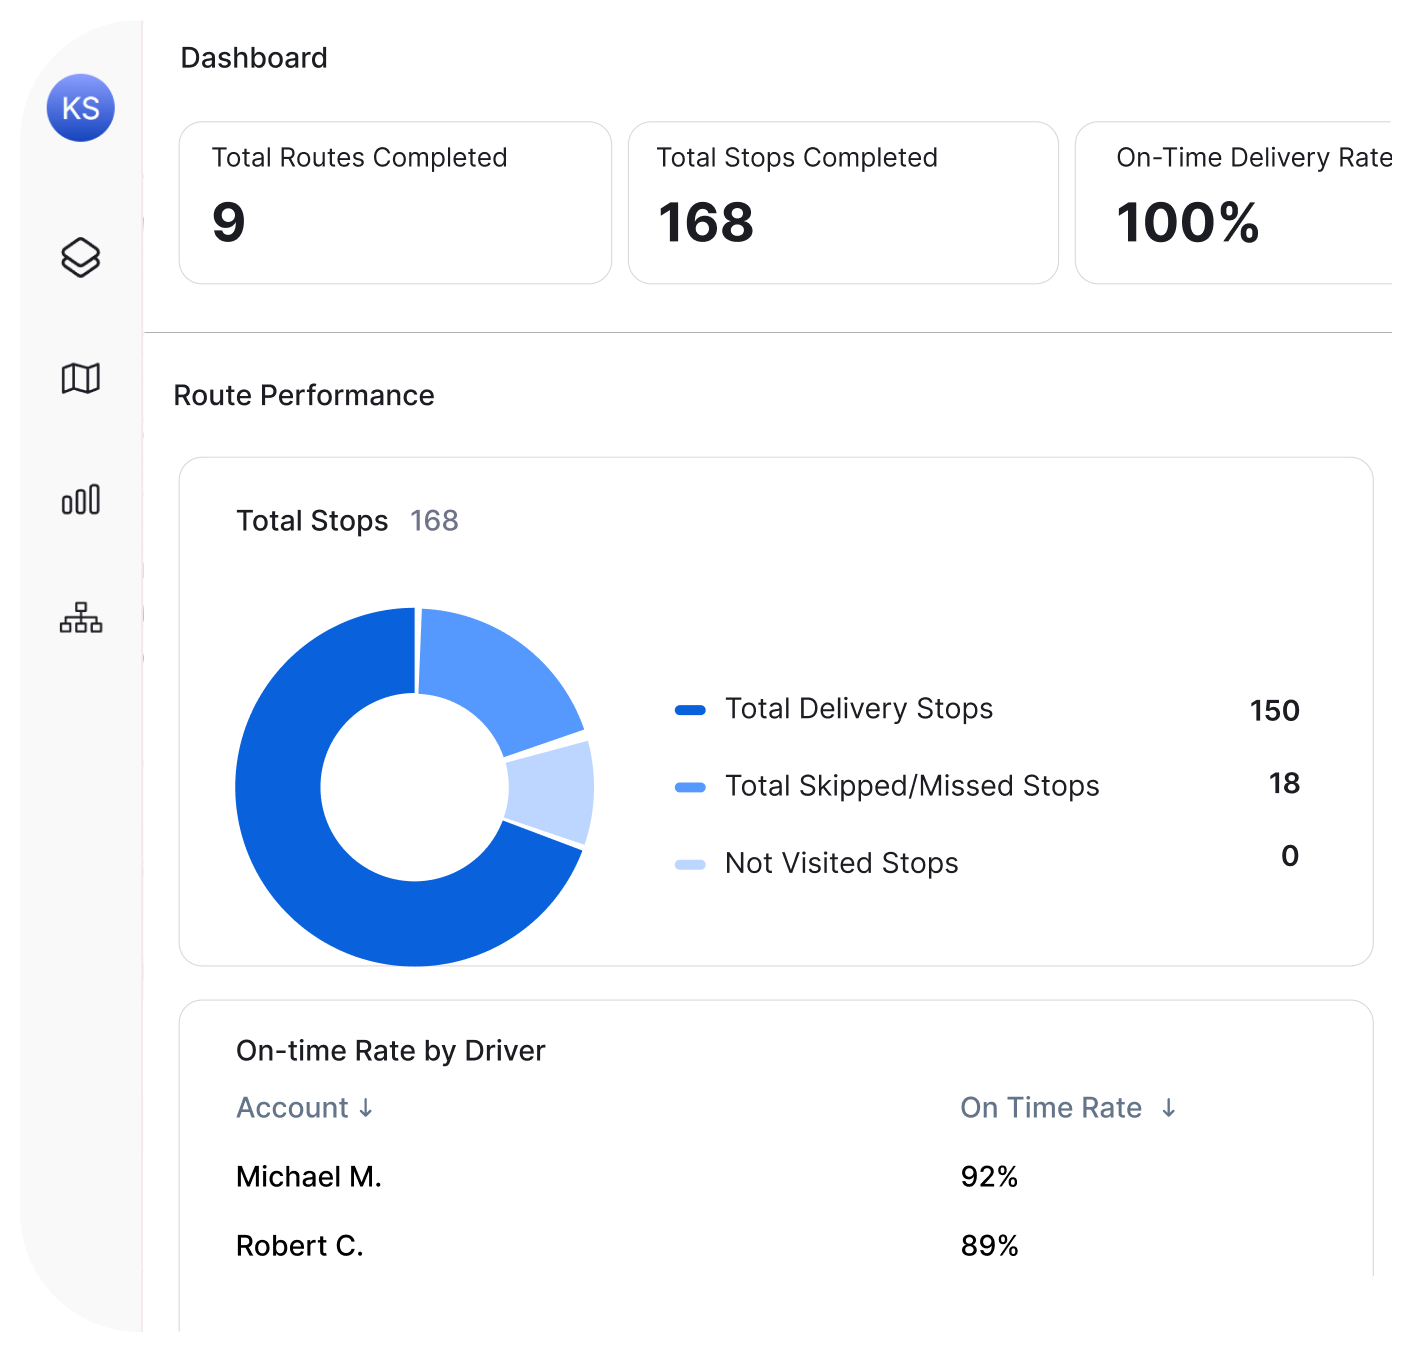
See how today is going without asking anyone. Routes in progress, stops completed, on-time rate, delays — all visible at a glance, updating live.
Driver-by-Driver Performance
Compare drivers objectively. Stops per hour, on-time percentage, service time, completion rate — tracked automatically for every driver, every day.
One-Click Reports for Stakeholders
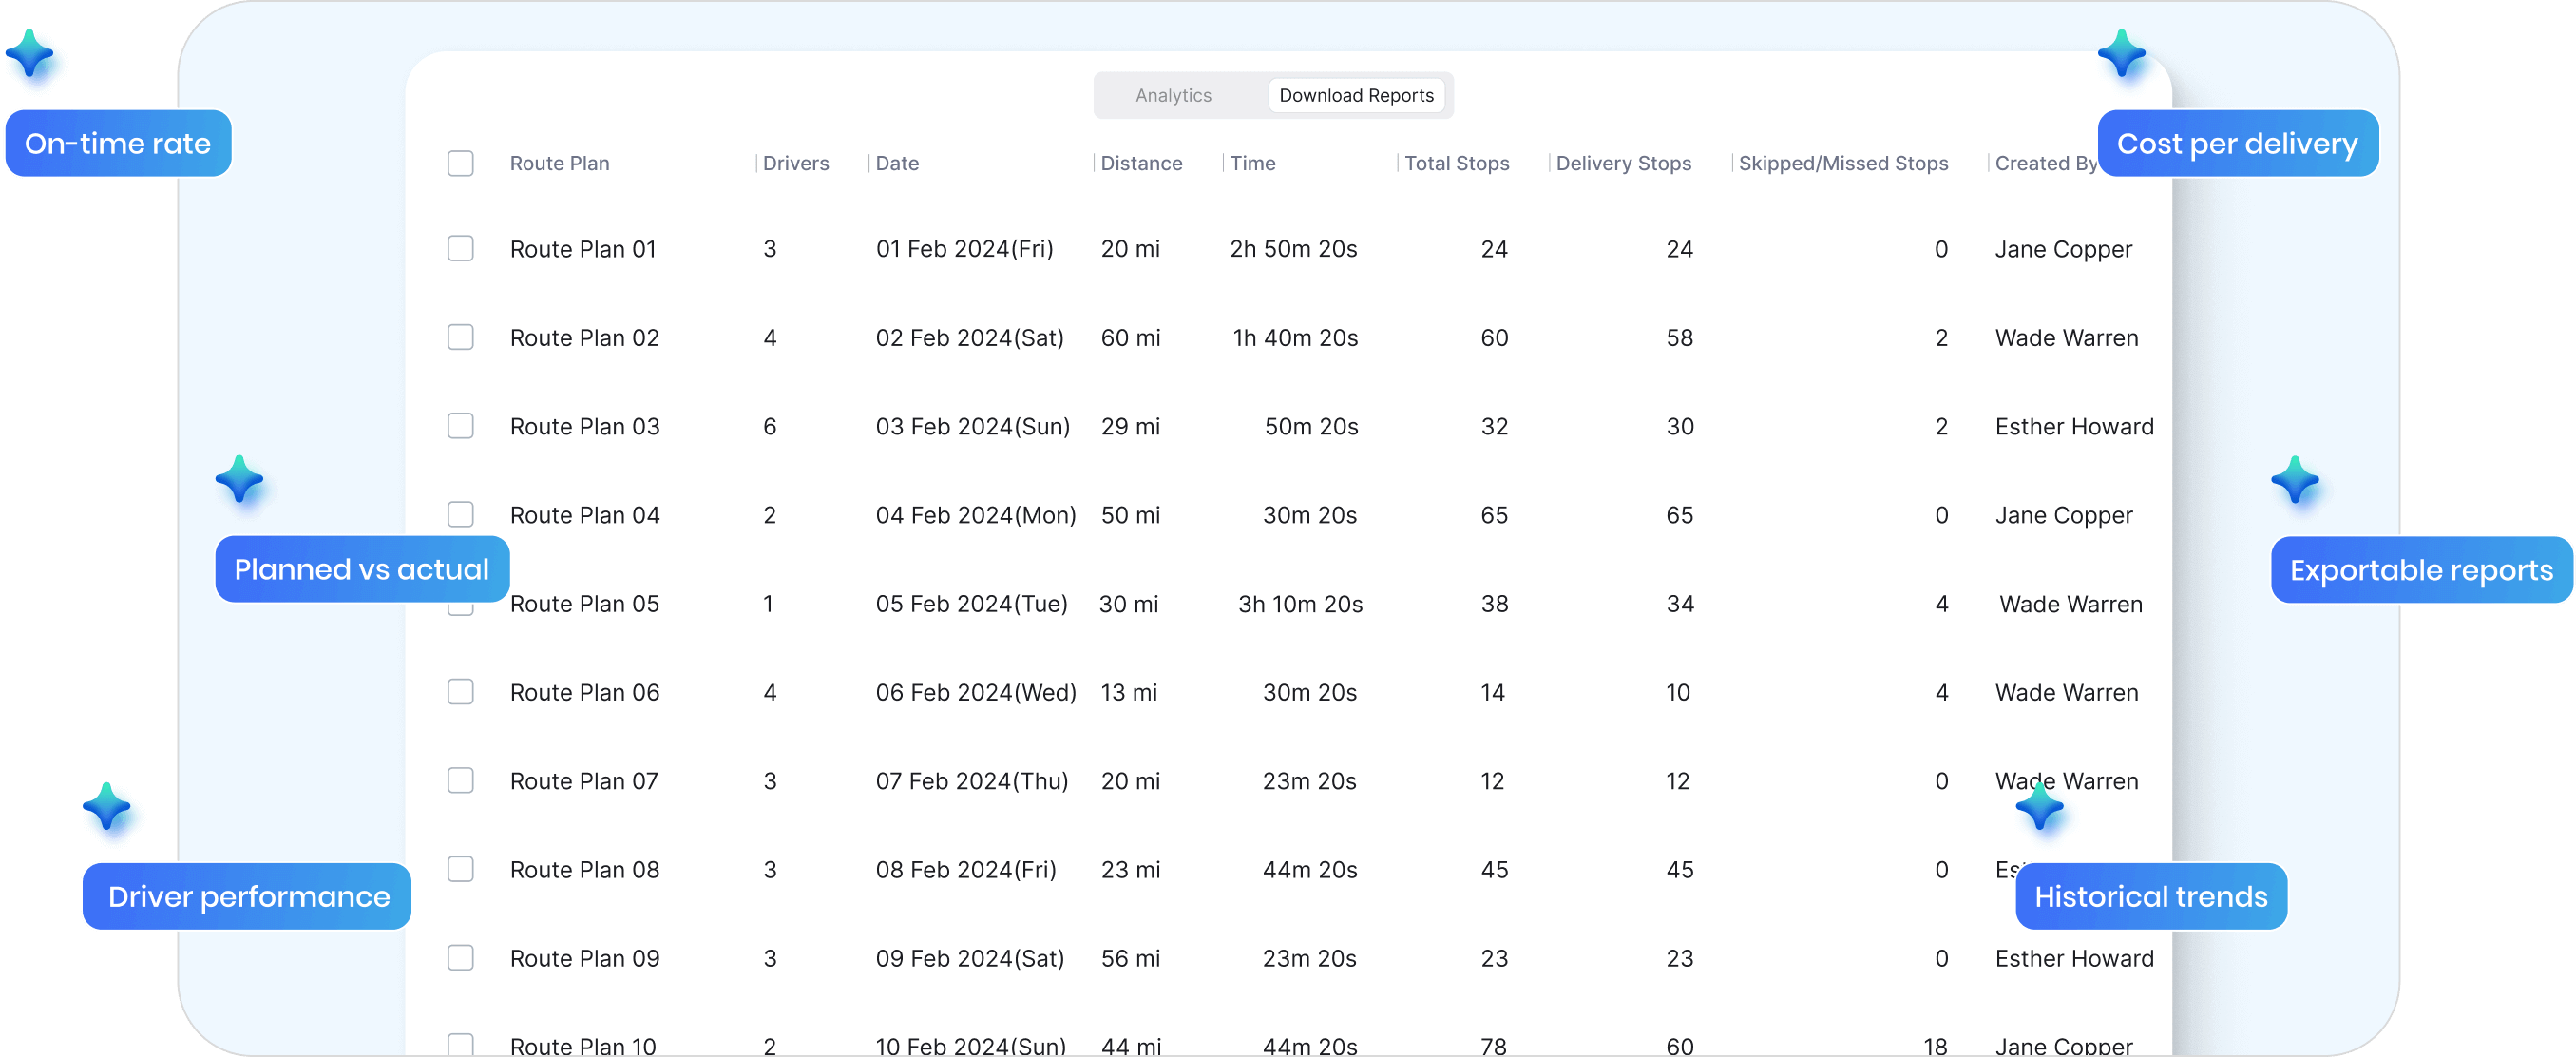
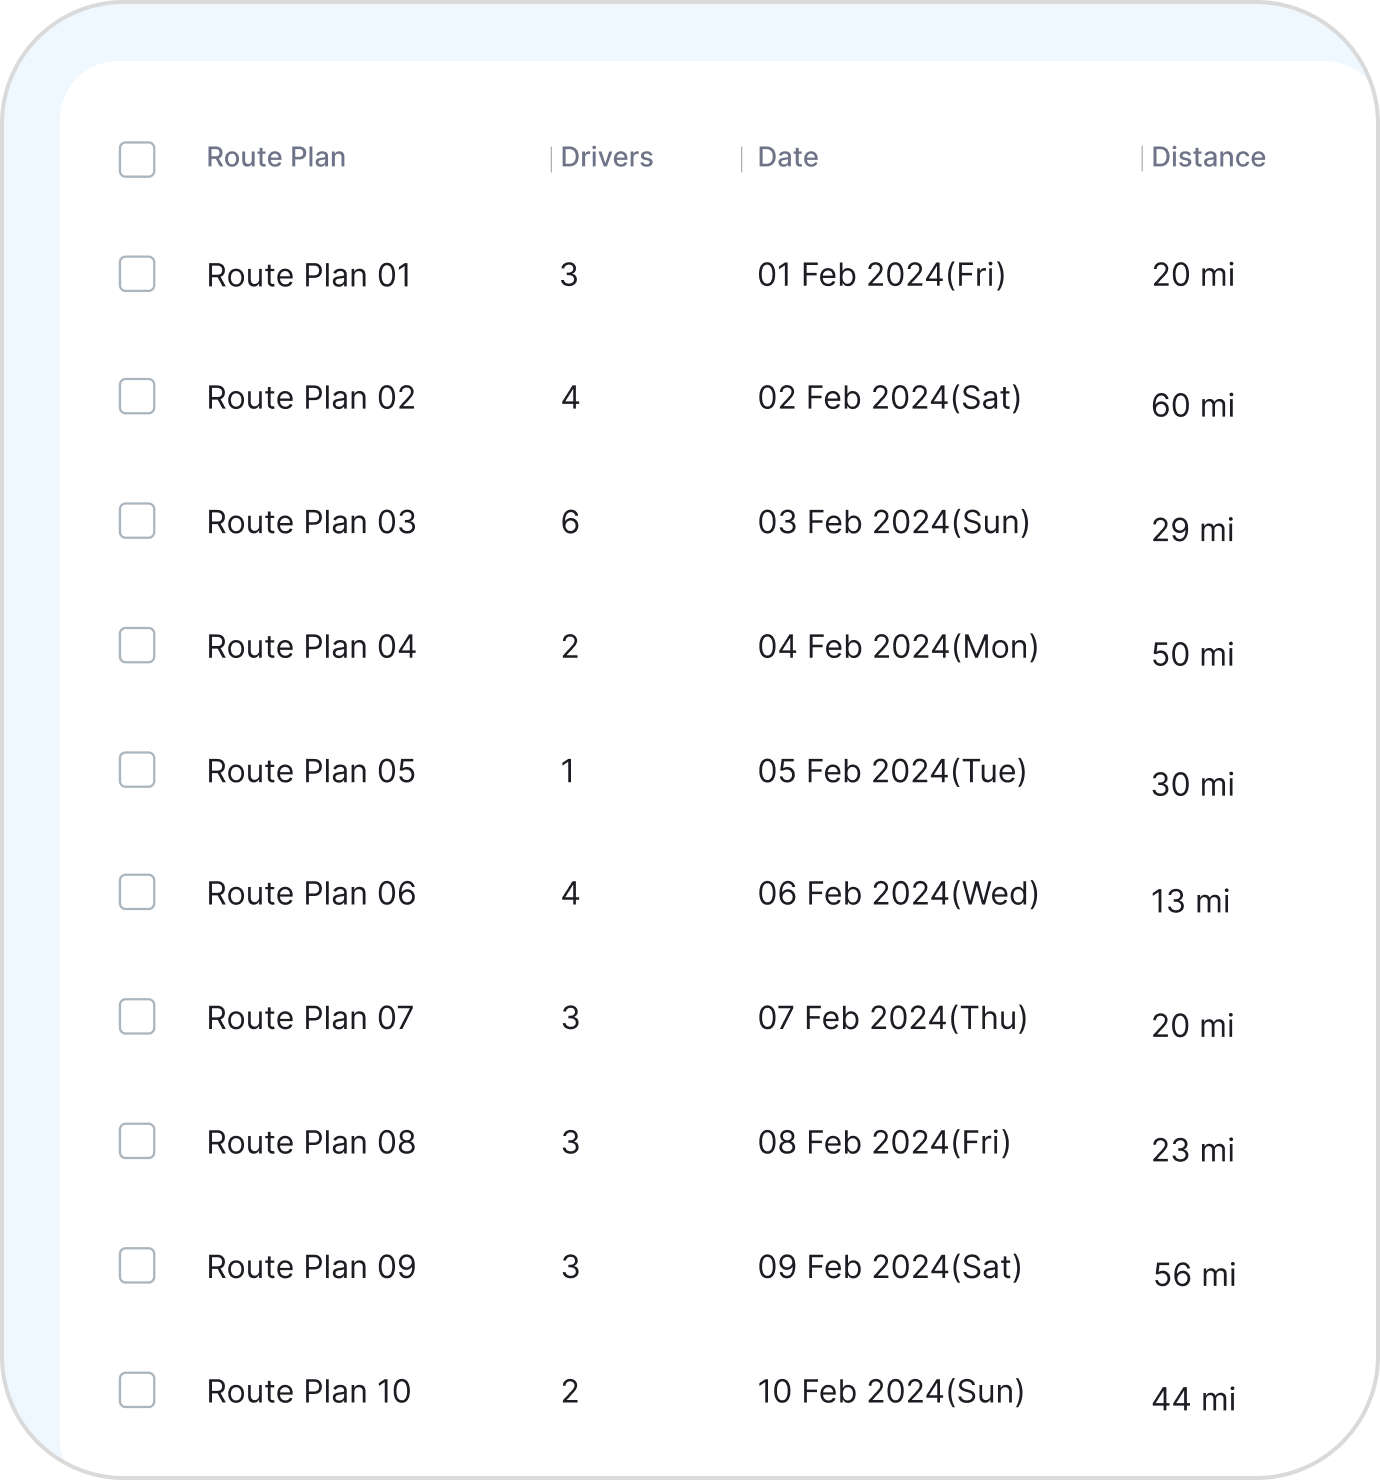
Leadership wants numbers? Export them in seconds. Daily, weekly, monthly — filter by date, driver, or route and download reports ready to share.
Spreadsheets vs. Real Analytics
The Usual Way

Data scattered across apps, spreadsheets, and memory
Hours spent building reports before leadership meetings
“How are we doing?” answered with gut feel
Driver performance judged by who complains least
Problems discovered when customers call
Planned vs actual? No idea.

The Upper Way
Everything in one dashboard, updated automatically
Export any report in seconds, filter by date or driver
On-time rate, cost per delivery, driver performance — ready when asked
Objective metrics for every driver, every route
Issues visible in real-time before they escalate
Every route compared — time, miles, stops — automatically
Every Metric You Need to Run
a Smarter Operation
Real-time dashboards are just the start. Upper gives you planned vs actual comparisons, cost tracking, historical trends, and flexible filtering — so you can answer any question about your operation.
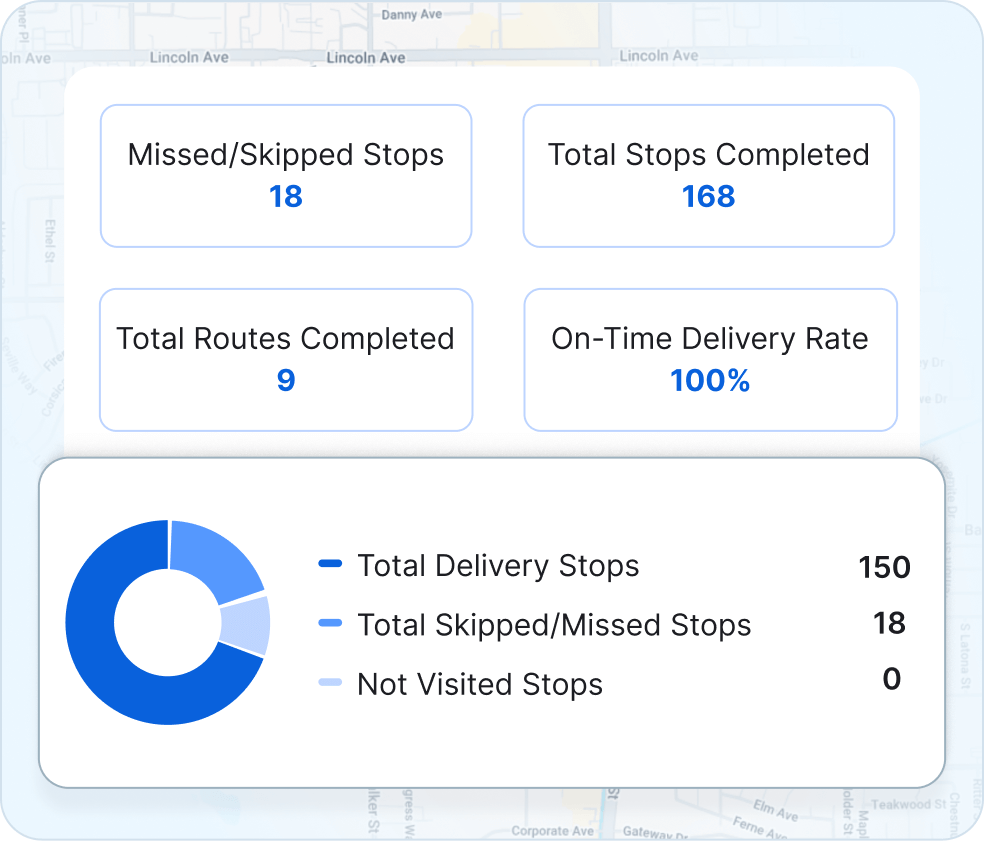
Planned vs Actual Analysis — See Where Routes Go Off Track
Compare what was planned to what actually happened. Time, miles, stops — all tracked automatically. Find where routes take longer than expected and why.
-
 Planned vs actual time for every route
-
Planned vs actual miles driven
-
Stop-by-stop comparison to find delays

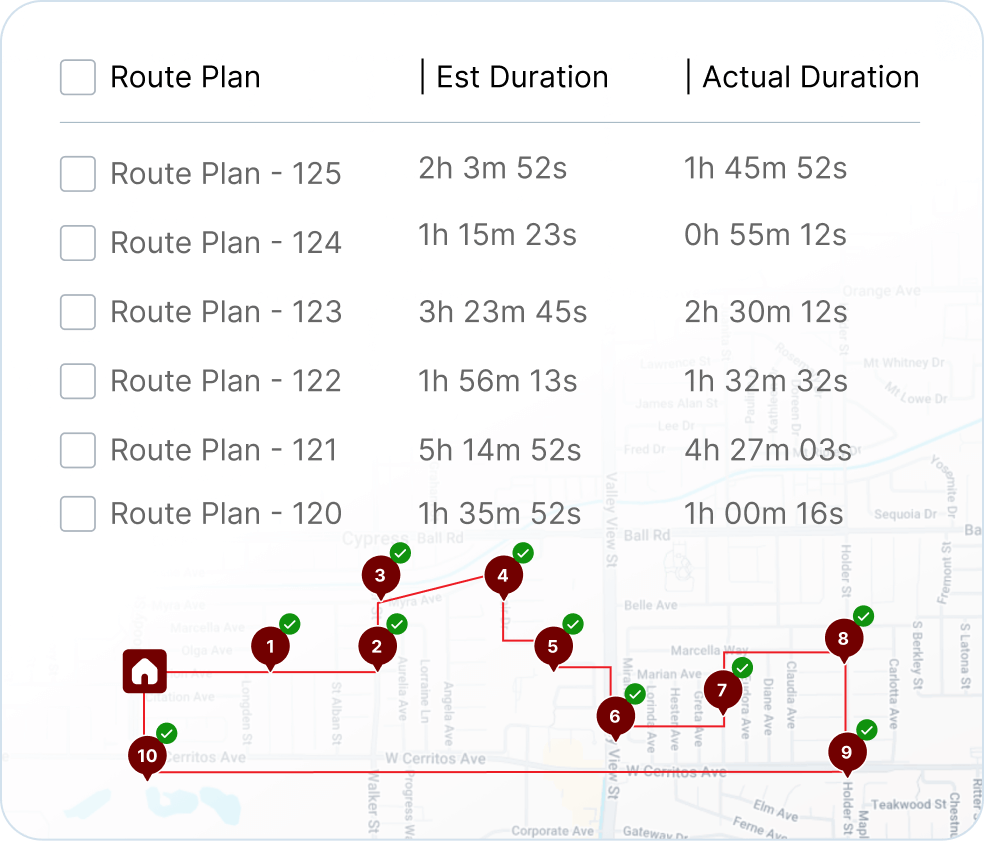
Cost & Savings Metrics — Prove ROI With Real Numbers
Track cost per delivery, miles saved, and time reduced. Upper gives you the data to prove your operation is improving — and justify the investment to leadership.
-
Cost per delivery and cost per mile
-
Total miles and hours saved vs manual planning
-
Export savings reports for stakeholders
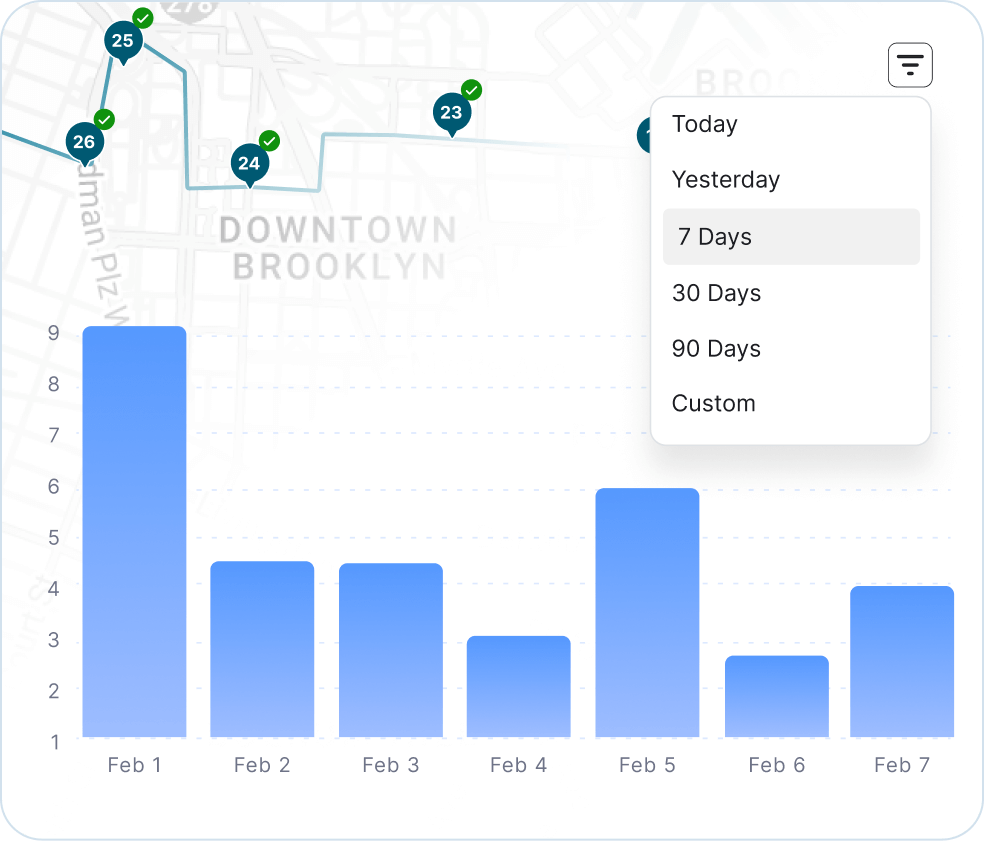
Historical Trends — Track Improvement Over Time
See how your operation is performing week-over-week, month-over-month. Spot patterns, track progress, and prove that changes are working.
-
Week-over-week and month-over-month comparisons
-
On-time rate trends over any date range
-
Driver performance trends over time
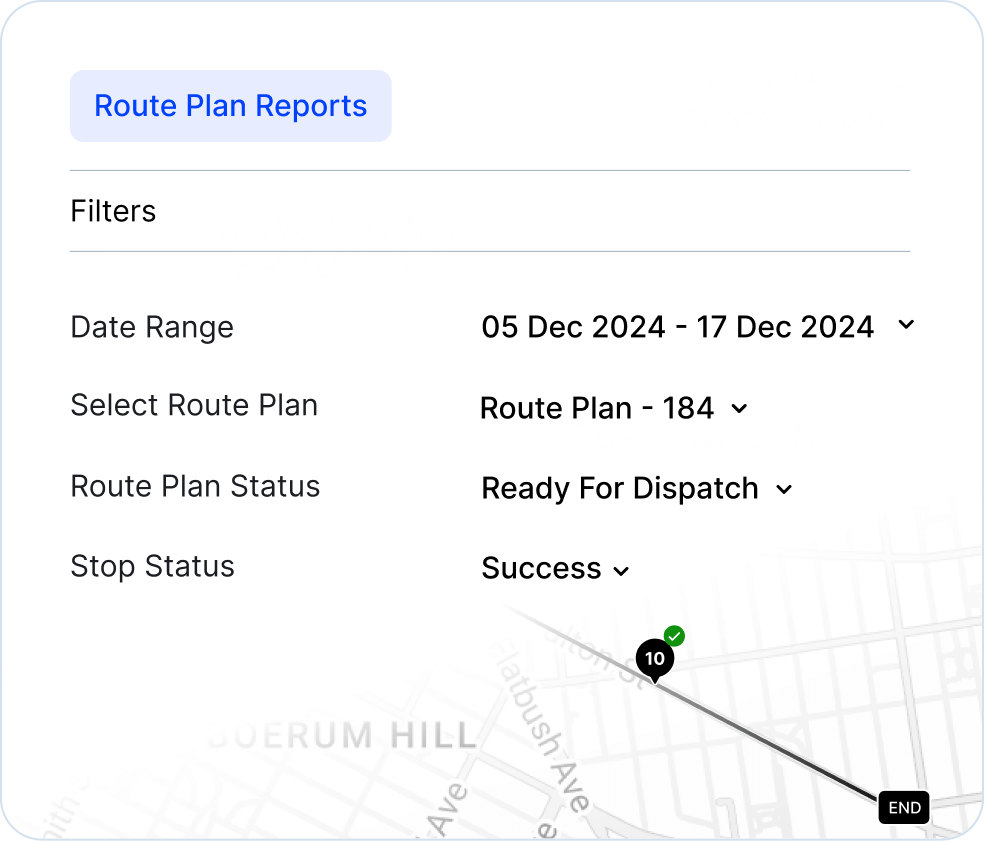
Custom Filters & Date Ranges — Slice the Data However You Need
Filter by driver, route, date range, or delivery status. Answer any question without building a custom report. The data is already there — just filter and view.
-
Filter by driver, vehicle, or territory
-
Custom date ranges for any time period
-
Save filtered views for quick access

“We used to spend 2 hours every morning planning routes in spreadsheets. Now it takes 10 minutes. Upper paid for itself in the first week”


“Customers reschedule on us constantly. Before Upper, every change meant phone calls and confusion. Now I move the stop, the driver’s app updates automatically, and the customer gets a new ETA. No drama”


“Our techs actually follow the routes now. Before, they’d ignore the schedule and do their own thing because the routes never made sense. Upper plans routes they trust—so they stick to them.”

Plan Fast. Adapt Faster.
Try Upper free for 7 days—no credit card require.